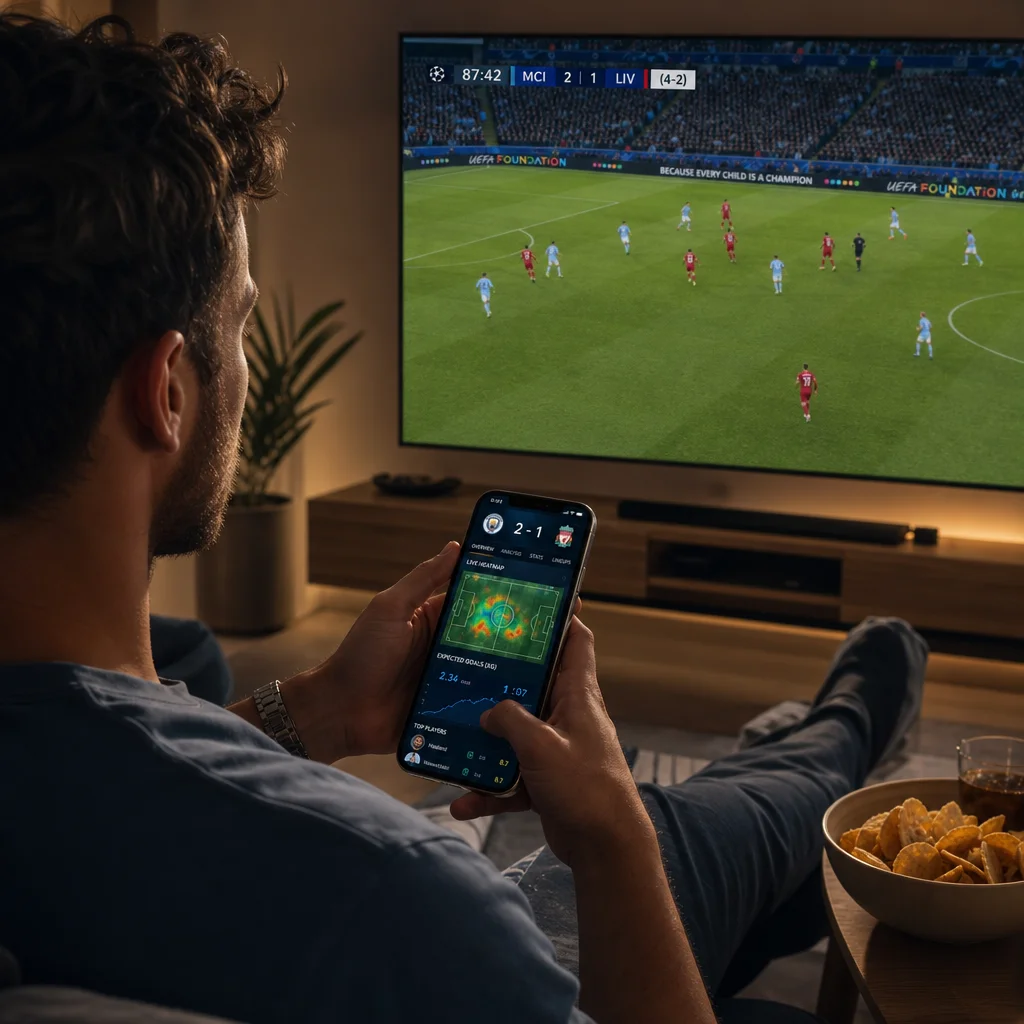
The whistle blows, the crowd erupts, and somewhere between the roar of the stadium and the calm of your living room, a small screen lights up in your hand. Following a major match no longer means sitting still and watching a single linear broadcast. Millions of viewers now keep a phone, a tablet, or a laptop within arm’s reach, tracking live possession percentages, expected goals, sprint speeds, and real-time win probability. This second-screen habit has quietly reshaped how we consume sport, transforming passive observation into an active, layered, and deeply personal ritual.
What the Second Screen Actually Adds
Traditional television coverage locks you into one camera angle, one pair of commentators, and one editorial narrative. A second screen gives you the missing pieces of the puzzle. While the main broadcast follows the ball, your phone can show the entire tactical shape of the pitch, the heat map of an exhausted full-back, or the passing network of a midfield trio that keeps recycling possession. The result is a compelling duality: you experience the raw emotion on the big screen and analyze the tactical mechanics on the small one.
This behavior is not entirely new, but it has evolved from a casual distraction into a refined art form. A decade ago, a fan might have occasionally glanced at a live score app during halftime. Today, the secondary device runs continuously, often with multiple tabs open for advanced analytics. Behavioral research on live sports consumption consistently shows that a massive share of viewers rely on a second device during high-profile fixtures, with engagement spiking during tournament knockouts and continental finals. The second screen is no longer a distraction from the match; for millions of modern supporters, it is the lens through which the game finally makes complete sense.
The Stats That Matter Most
A live data feed can bombard you with dozens of metrics, and chasing every single number turns an intense sporting event into a dry spreadsheet. The most rewarding approach is to curate a lean set of metrics that answer the questions you actually care about: who is dictating the tempo, who is generating high-quality chances, and who is physically running out of steam. Everything else is pure noise that can safely wait for the post-match tactical breakdown.
Possession and Territory
Possession statistics serve as the entry point for most viewers, yet they remain among the most frequently misinterpreted numbers in sport. Merely holding sixty percent of the ball does not automatically translate into dominance. What truly matters is *where* that possession occurs. A side that endlessly circulates the ball between its centre-backs owns the statistics, but not the match. Pair the raw percentage with a territory map or a final-third entry chart, and the true picture sharpens instantly. Look for sustained pressure near the opponent’s penalty box rather than a sterile passing loop in the middle third.
Expected Goals and Shot Quality
Expected goals, universally known as xG, has become the crown jewel of the second-screen era. This metric assigns a numerical probability to every shot based on variables such as distance from the goal, shooting angle, defensive pressure, and the quality of the build-up play. A team can register fifteen low-percentage shots from outside the box and still possess a lower total xG than an opponent with just four clinical attempts from inside the area. When the xG trendline diverges wildly from the actual scoreline, you are watching a match that is either tactically unbalanced or on the verge of a dramatic swing. That analytical gap is arguably the most valuable piece of live intelligence a fan can hold in their palm.
Physical and Sprint Data
Total distance covered and high-intensity sprint counts used to be restricted to post-match scouting reports. Today, they update in near real time, validating or refuting what your eyes suspect on the screen. When a full-back’s high-speed sprint total drops off a cliff after the seventieth minute, the opposing winger suddenly looks twice as dangerous. When a central midfielder’s distance covered plateaus while the opposition relentless presses, defensive structural cracks inevitably appear. While these numbers do not predict goals directly, they reliably highlight the exact spaces on the pitch where goals are born.
Momentum Graphs
Momentum charts compress attacking pressure, territorial dominance, and dangerous sequences into a single rolling waveform. Though imperfect and prone to algorithmic quirks, they excel at capturing the fluctuating rhythm of a match. A prolonged surge in one direction almost always signals a wave of corner kicks, tactical set pieces, and tired defensive legs. Watching these lines swing back and forth provides the closest thing to reading a football match’s vital signs in real time.
Latency Is the Hidden Enemy
Every digital live feed operates with a time delay. The gap between the actual physical event on the pitch and the statistical update on your phone can range from a couple of seconds to well over a minute, depending on your streaming provider, network stability, and mobile application. This disparity creates a peculiar form of cognitive dissonance: your screen might notify you of a goal before the broadcast even shows the buildup, or worse, your phone celebrates an incident that the referee is currently reviewing on the pitchside monitor.
The practical solution is to understand your specific broadcast delay and adapt your viewing habits accordingly. If your stats feed consistently runs ahead of the video stream, treat the numbers as an exciting preview and enjoy the heightened anticipation. If your data lags behind the picture, use it purely as a confirmation tool. Many seasoned match-goers deliberately mute goal alerts on their secondary devices and keep only the statistical dashboard visible, ensuring nothing ruins the live broadcast surprise. Others embrace the early buzz as part of the modern ritual. There is no single correct approach, provided you are prepared for the lag.
Choosing Your Optimal Setup
You do not need expensive, multi-monitor hardware to follow a game effectively. A stable internet connection, a fully charged device, and two or three carefully selected tools will outperform a chaotic wall of screens. The ultimate objective is a layout that you can parse in a single glance, because your primary focus should remain on watching the sport, not managing a mission control center.
- Dedicate one mobile device exclusively to the stats dashboard while keeping the broadcast audio loud on your television or main monitor.
- Position your secondary screen slightly below eye level so it never obstructs your view of the primary action.
- Enable a dark theme during evening matches to minimize glare and reduce eye strain over ninety minutes.
- Pin only the core metrics you genuinely check frequently, hiding secondary data behind a menu tap.
- Plug your device into a power source before kickoff, as live data dashboards consume battery power rapidly.
Notification Discipline
Perhaps the most underrated skill for the modern sports fan is notification management. A phone that buzzes incessantly with every single throw-in, yellow card, and tactical substitution destroys the deep focus that the second screen is meant to facilitate. Before the opening whistle, decide which specific events truly warrant an immediate interruption. For most supporters, this means goals scored by their preferred team and nothing else. Everything else can wait until the half-time interval.
Disable duplicate alerts from competing apps. If two separate sports services notify you of the exact same event, one of them must be purged. Consolidate your sports applications into a single folder and silence the ones you rarely open. The quietest second screen is almost invariably the most useful one, because every notification alert you allow through should carry genuine analytical value rather than mindless noise.
When the Numbers Lie
Statistics describe reality; they do not completely explain it. A team can thoroughly dominate the expected goals battle and still lose because an opposition goalkeeper produces a legendary, career-defining performance. Conversely, a side can win comfortably while losing the possession battle by thirty percentage points. Context is absolute king: red cards, tactical injuries, adverse weather conditions, and the current scoreline completely alter how raw numbers should be interpreted.
Treat live data as a set of intriguing questions rather than definitive answers. A sudden, sharp drop in passing accuracy might reflect intense defensive pressure, or it might simply indicate a tactical shift toward direct, long-ball tactics following a substitution. The best second-screen users constantly ask *why* a metric shifted, utilizing the television broadcast to gather visual evidence. Numbers stripped of context are merely decorative decoration.
The Social Layer
The second-screen experience is inherently communal. Group chats light up with intense activity during major fixtures, and a significant percentage of those messages are instant reactions to the exact same statistics everyone is tracking in real time. Sharing a momentum chart or an opponent’s passing map has become a sophisticated way of debating tactics without shouting. It provides supporters with a shared technical language and an objective tool to settle arguments that historically ended in vague subjective impressions.
Naturally, there is a social cost to this constant connectivity. Staring down at a phone during a legendary match can pull you entirely out of the shared physical moment, particularly if you are watching alongside friends who came for the stadium atmosphere rather than the analytics. A simple boundary helps: check your dashboard during natural breaks in play rather than dynamic passages, and put the device completely away during major turning points. The data will still be waiting for you in ten seconds; the live celebration will not.
Building a Matchday Routine
A modest amount of preparation transforms the entire matchday viewing experience. Taking just thirty minutes before kickoff to organize your workspace makes the process automatic and seamless.
- Review official team sheets and starting lineups, identifying two or three specific player matchups worth monitoring closely.
- Launch a single comprehensive stats dashboard and close all unrelated browser tabs or applications.
- Configure your notification rules and silence all mobile alerts unrelated to the fixture.
- Charge your device fully and ensure it connects to the same robust network as your video broadcast.
- Decide in advance which specific metric will dictate your tactical reading of the game.
After the final whistle blows, spend five quiet minutes comparing what the analytical data suggested against what your eyes witnessed on the pitch. This simple habit builds genuine tactical literacy over the course of a season. You will soon begin recognizing systemic patterns before they fully materialize on screen, turning your second screen into an empowering educational tool rather than a blinking slot machine of random numbers.
Final Whistle
A major football match is an evolving story told at blistering speed, and the second screen is how modern fans read along between the lines. It supplies vital contextual depth that a standard broadcast cannot possibly fit into ninety minutes, explains the invisible physical fatigue behind a late winner, and elevates casual pub arguments into intelligent conversations. Utilized with a healthy dose of discipline, live data deepens your attention rather than fracturing it. The next time the referee blows the opening whistle, keep your phone close by, choose your metrics wisely, and let the small screen quietly illuminate what the big one is truly revealing.